Dynamic Signal Analyzer - SR785
SR785
SR785 Dynamic Signal Analyzer The SR785 Two-Channel Dynamic Signal Analyzer is a precision, full-featured signal analyzer that offers state-of-the-art performance at a price tha...
广西科米瑞实验仪器设备有限公司提供 Stanford Research Systems SR785 产品资料、选型咨询、供货报价和售后服务支持,价格面议。
← 返回产品列表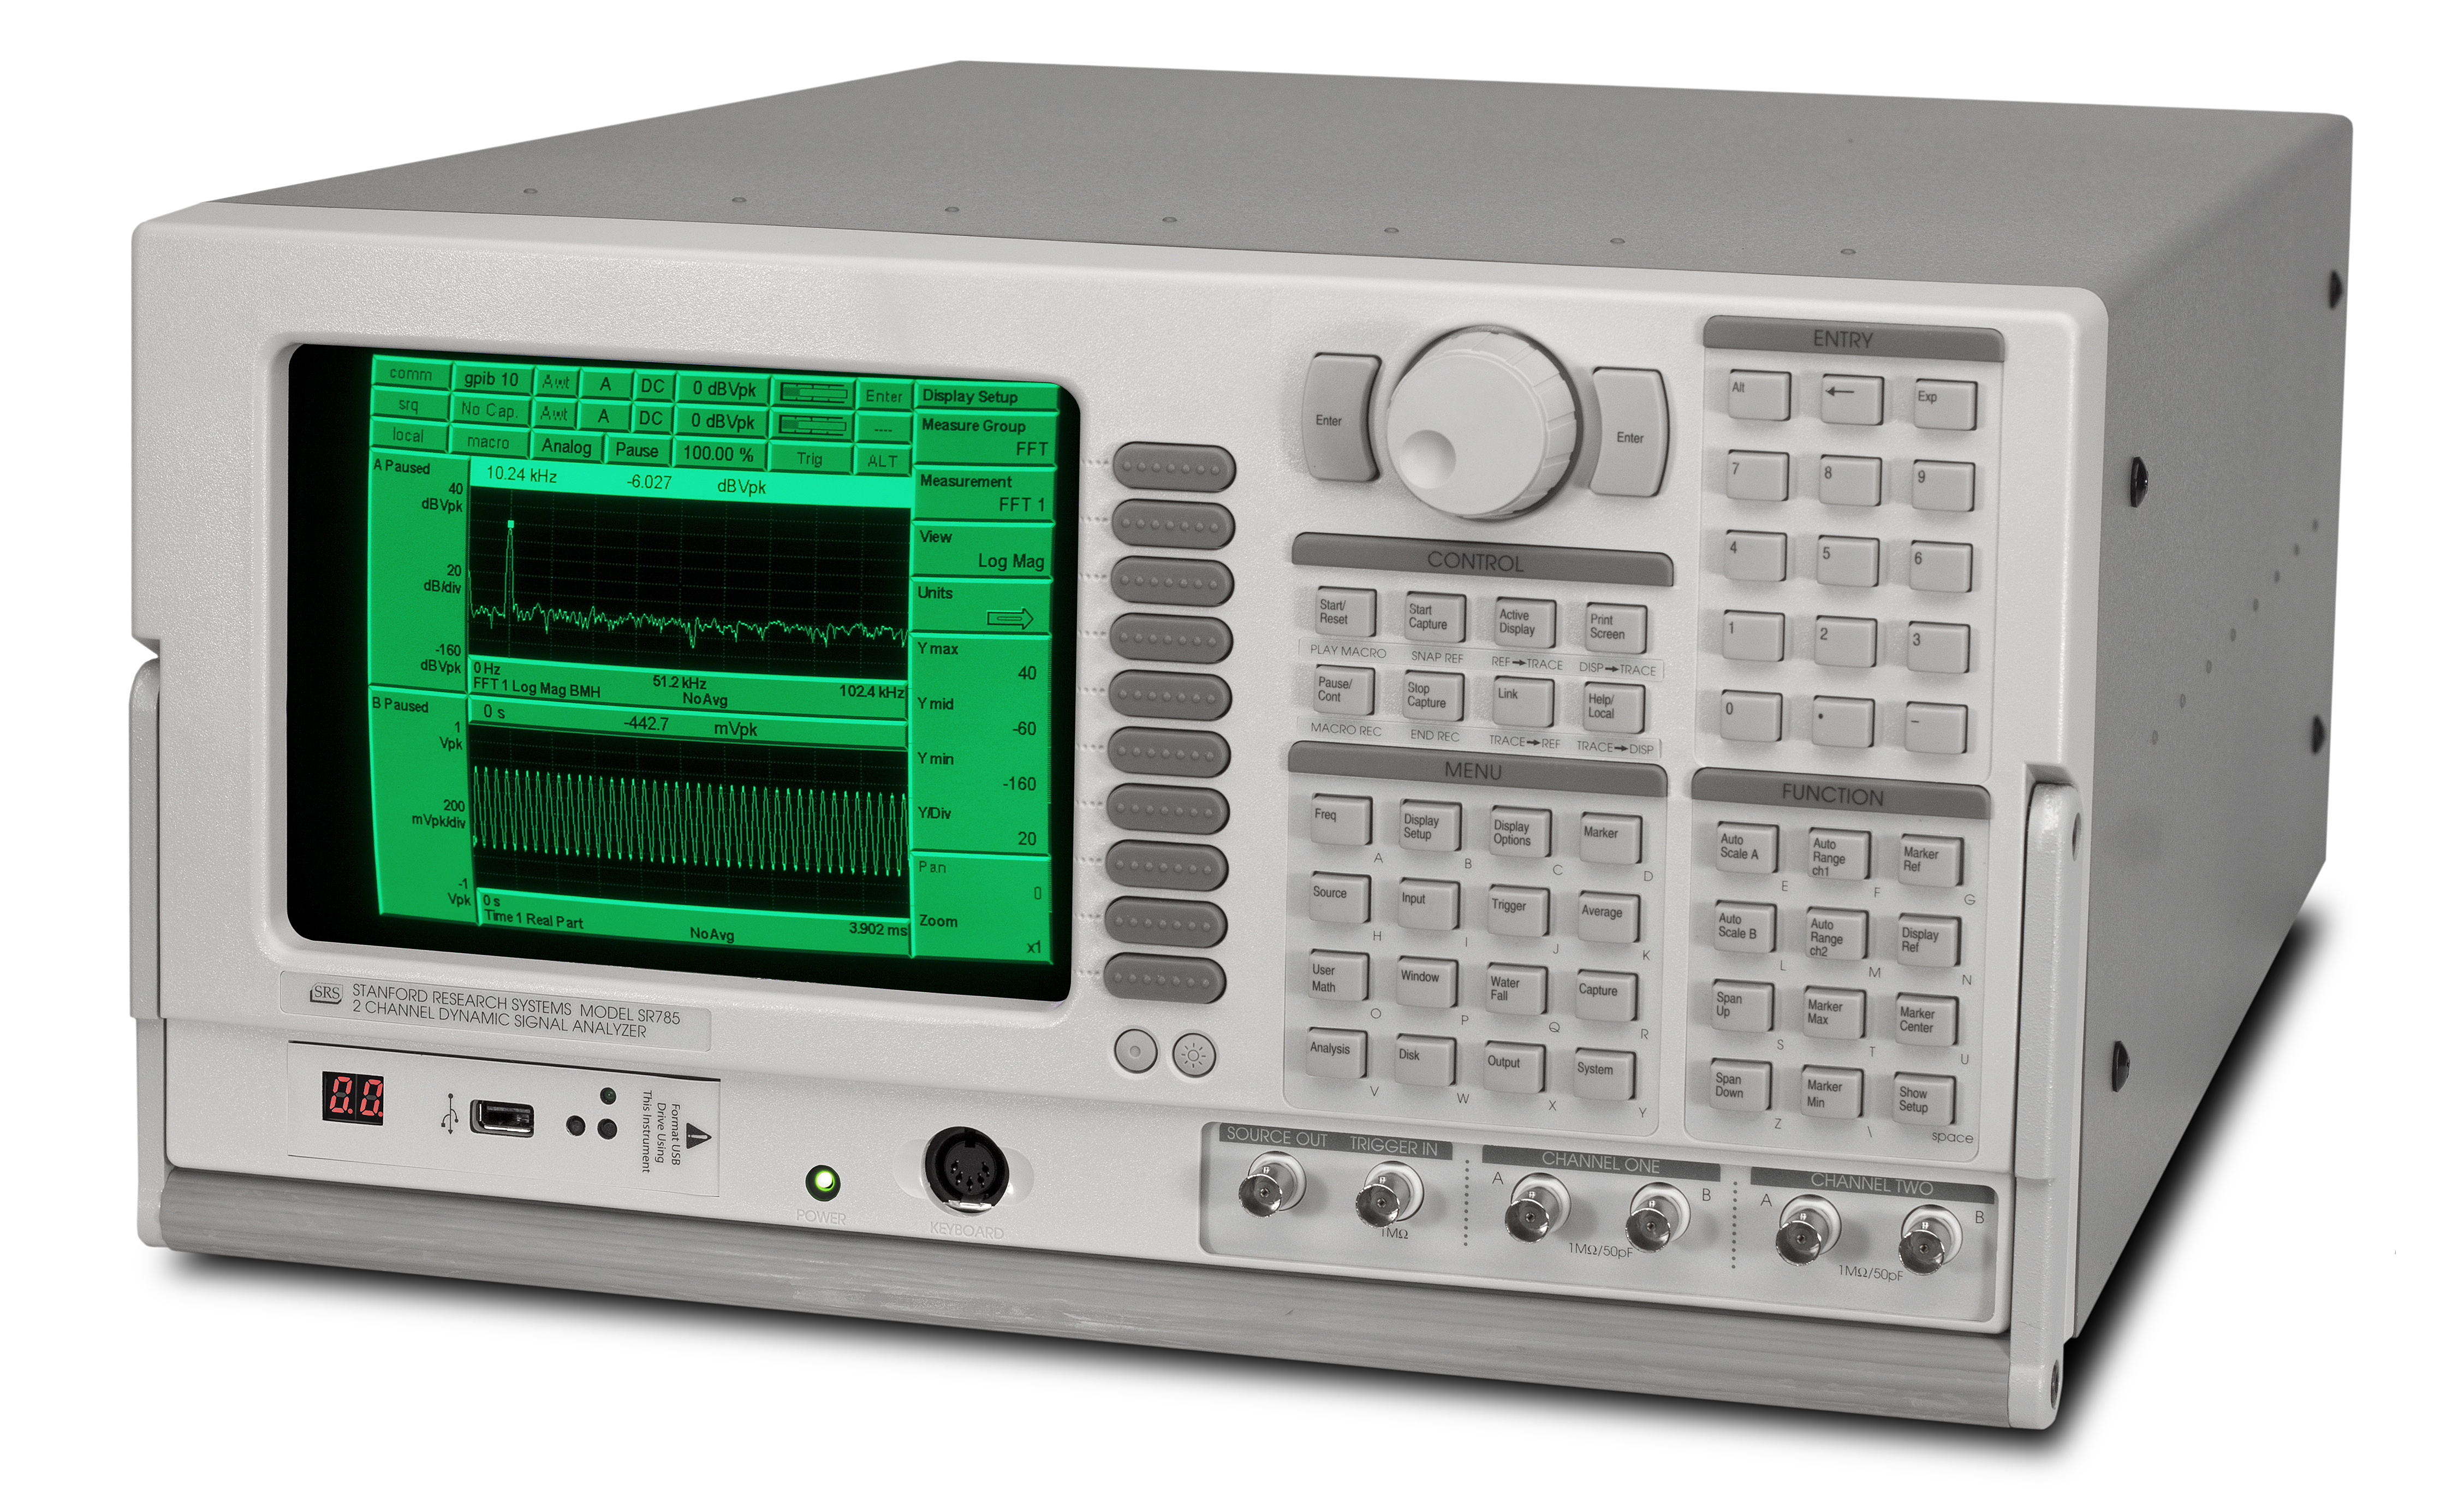
说明
SR785 Dynamic Signal Analyzer The SR785 Two-Channel Dynamic Signal Analyzer is a precision, full-featured signal analyzer that offers state-of-the-art performance at a price that's less than half that of competitive analyzers. Building on its predecessor, the SR780, the SR785 incorporates new firmware and hardware that make it the ideal instrument for analyzing both mechanical and electrical systems. ... click for SR785 Tech Support Rack Mount Kit Drawing SR785 Volatility Statement About FFTs Data Conversion Utility SR780 FFT Analyzer SR770 FFT Analyzer Rack Mount Kit Dwg. SR785 Volatility Statement About FFTs SR785 — Dynamic Signal Analyzer The SR785 Two-Channel Dynamic Signal Analyzer is a precision, full-featured signal analyzer that offers state-of-the-art performance at a price that's less than half that of competitive analyzers. Building on its predecessor, the SR780, the SR785 incorporates new firmware and hardware that make it the ideal instrument for analyzing both mechanical and electrical systems. For measurements involving servo systems, control systems, acoustics, vibration testing, modal analysis, or machinery diagnostics, the SR785 has the features and specifications to get the job done. Standard measurement groups include FFT, order tracking, octave, swept-sine, correlation, time capture, and time/histogram. The SR785 brings the power of several instruments to your application: a spectrum analyzer, network analyzer, vibration analyzer, octave analyzer and oscilloscope. Narrow & Wide Band FFTs X Narrow & Wide Band FFTs SR785 Dynamic Signal Analyzer Narrow & Wide Band FFTs A unique measurement architecture allows the SR785 to function as a typical dual-channel analyzer with measurements like cross spectrum, frequency response, coherence, etc. Alternatively, the instrument can be configured so that each input channel functions as a single-channel analyzer with its own span, center frequency, resolution and averaging. This allows you to view a wide-band spectrum and simultaneously zoom in on spectral details. The same advanced architecture provides storage of all measurement building blocks and averaging modes. Vector averaged, rms averaged, unaveraged, and peak hold versions of all measurements are simultaneously acquired and can be displayed without re-taking data . The SR785 comes equipped with a wide selection of averaging techniques to improve your signal-to-noise ratio . RMS averaging reduces signal fluctuations, while vector averaging minimizes noise from synchronous signals. Peak hold averaging is also available. Both linear and exponential averaging are provided for each mode. Because the SR785 is so fast, there's no need for a separate "fast averaging" mode. For instance, in a full-span FFT measurement with a 4 ms time record, 1000 averages take exactly 4 seconds, during which the SR785 still operates at its maximum display rate. For impact testing, the average preview feature allows each time record or spectrum to be accepted or rejected before adding it to the measurement. Order Map, Tracked Order X Order Map, Tracked Order SR785 Dynamic Signal Analyzer Order Map, Tracked Order Order tracking is used to evaluate the behavior of rotating machinery. Measurement data is displayed as a function of multiples of the shaft frequency (orders), rather than absolute frequency. Combined with a waterfall plot, the SR785 provides a complete history or "order map" of your data as a function of time or rpm. Using the slice feature, the amplitude profile of specific orders in the map can be analyzed. In tracked order mode, the intensity of individual orders vs rpm is measured. Unlike other analyzers, there's no need to track a limited number of orders to ensure full speed measurements. The SR785's speed allows simultaneous tracking of up to 400 orders. Run-up and run-down measurements are available in both polar and magnitude/phase formats. RPM profiling is provided to monitor variations of rpm as a function of time. A complete selection of time and rpm triggering modes is included, allowing you to make virtually any rotating machinery measurement. Real-time 1/1, 1/3 and 1/12 octave analysis, at frequencies up to 40 kHz (single channel) or 20 kHz (two channel), is a standard feature of the SR785. Octave analysis is fully compliant with ANSI S1.11-1986 (Order 3, type 1-D ) and IEC 225-1966 . Switchable analog A-weighting filters, as well as A, B and C weighting math functions, are included. Averaging choices include exponential time averaging, linear time averaging, peak hold, and equal confidence averaging. Broadband sound level is measured and displayed as the last band in the octave graph. Total power, impulse, peak hold and L eq are all available. Exponentially averaged sound power (L eq ) is calculated according to ANSI S1.4-1983 , Type 0. Octave displays can be plotted as waterfalls with a fast 4 ms storage interval. Once data is stored in the waterfall buffer, the SR785 can display centile exceedance statistics for each 1/1, 1/3 or 1/12 octave band, as well as for L eq . Swept-Sine Measurements Swept-sine mode is ideal for signal analysis that involves high dynamic range or wide frequency spans. Gain is optimized at each point in the measurement, producing up to 145 dB of dynamic range. A frequency resolution of up to 2000 points is also provided. Auto-ranging can be used with source auto-leveling to maintain a constant input or output level at the device under test (to test response at a specific amplitude, for instance). Auto-resolution ensures the fastest possible sweeps and adjusts the frequency steps in the scan based on the DUT's response. Phase and amplitude changes that exceed user-defined thresholds are measured with high frequency resolution, while small changes are measured using wider frequency steps between points. A choice of linear sweeps with high resolution, or logarithmic sweeps with up to eight decades of frequency range, is provided. Swept-Sine Bode Plot X Swept-Sine Bode Plot SR785 Dynamic Signal Analyzer Swept-Sine Bode Plot The time/histogram measurement group is used to analyze time-domain data . A histogram of the time data vs. signal amplitude is provided for accurate time domain signal characterization. Statistical analysis capabilities include both probability density function (PDF) and cumulative density function (CDF). The sample rate, number of samples, and number of bins can all be adjusted. The SR785 comes with 8 Mbytes of memory (32 Mbytes optional). Analog waveforms can be captured at sampling rates of 262 kHz or any binary sub-multiple, allowing you to optimize sampling rate and storage for any application. For example, 8 Msamples of memory will capture 32 seconds of time domain data at the maximum 262 kHz sample rate, or about 9 hours of data at a 256 Hz sample rate. Once captured, any portion of the signal can be played back in any of the SR785's measurement groups except swept-sine . The convenient Auto-Pan feature
相关产品
提交需求
请填写必填信息,我们将在工作日尽快回复。